I have designed and developed a tool can be used for standard data exploration and analysis. You can experiment either with the existing standard data or upload a datafile of your own. The data is preprocessed internally and can be explored using the standards plots provided by the tool. You can run predictive and prescriptive analysis depending on your hypothesis by running various Statistical Test, Clustering or Classification techniques.
Features of the Tool:
- It is build using Shiny web development framework for R.
- Provision for uploading own data.
- Pre-processing included and requires no coding or statistical background for data analysis.
- Highly interactive and flexible tool with results presented in simplified formats.
- Techniques implemented includes: Regression, Paired T Test, One-Way ANOVA, MANOVA, K-means, Expectation Maximization (EM) Clustering, Spectral & DBSCAN Clustering, Decision Tree, K-Nearest Neighbors, Random Forest, Naive Bayes Classifier, Support Vector Machine, Feed-Forward Neural Network.
Results of IRIS Dataset using the tool:
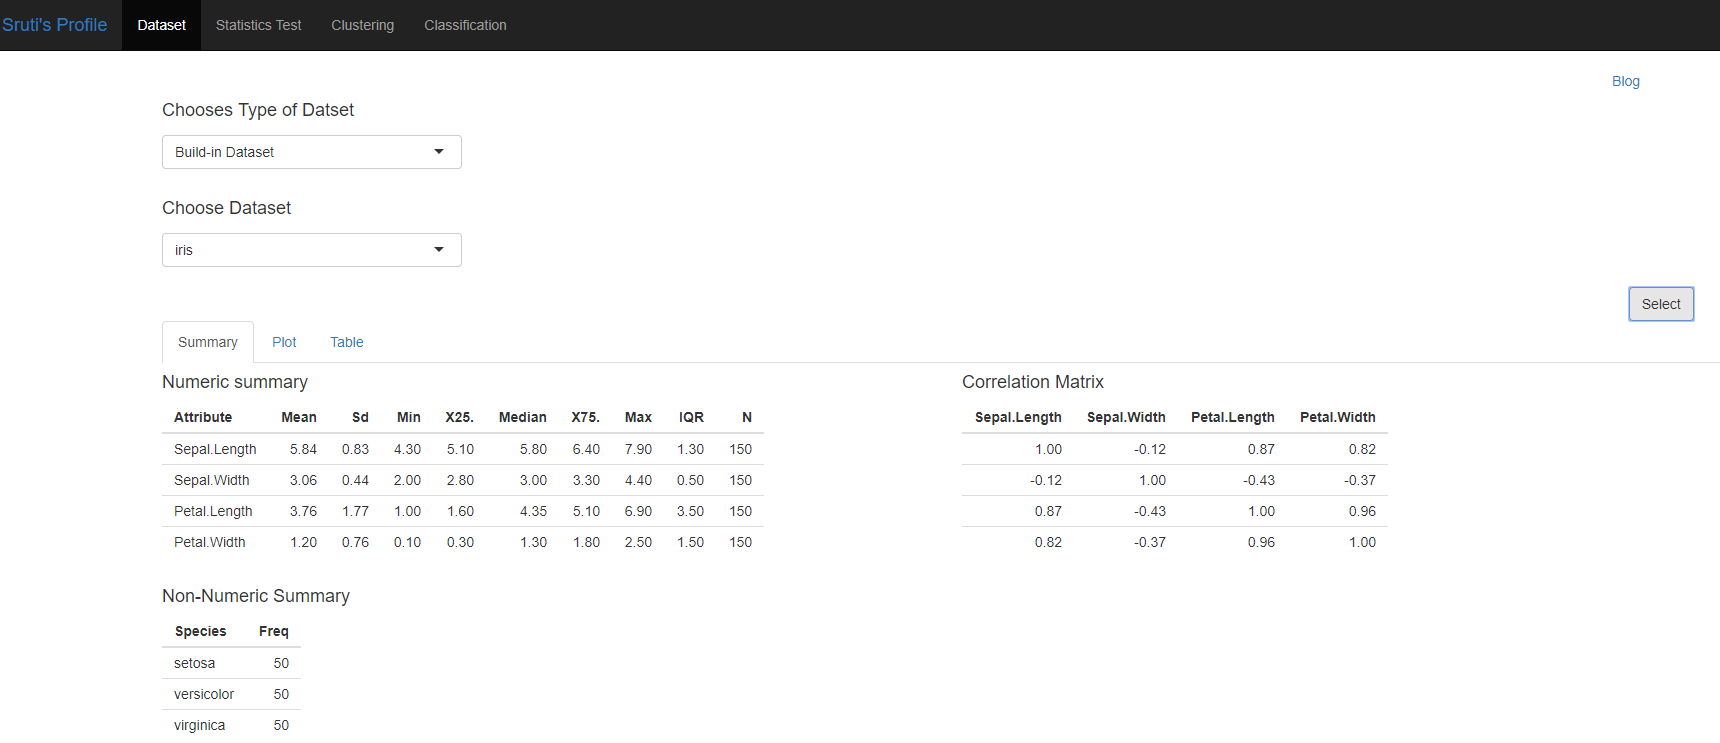
Step 1: Exploraing the Dataset for both qualitative and quantitative data and looking at the correlation of various variables within the dataset.
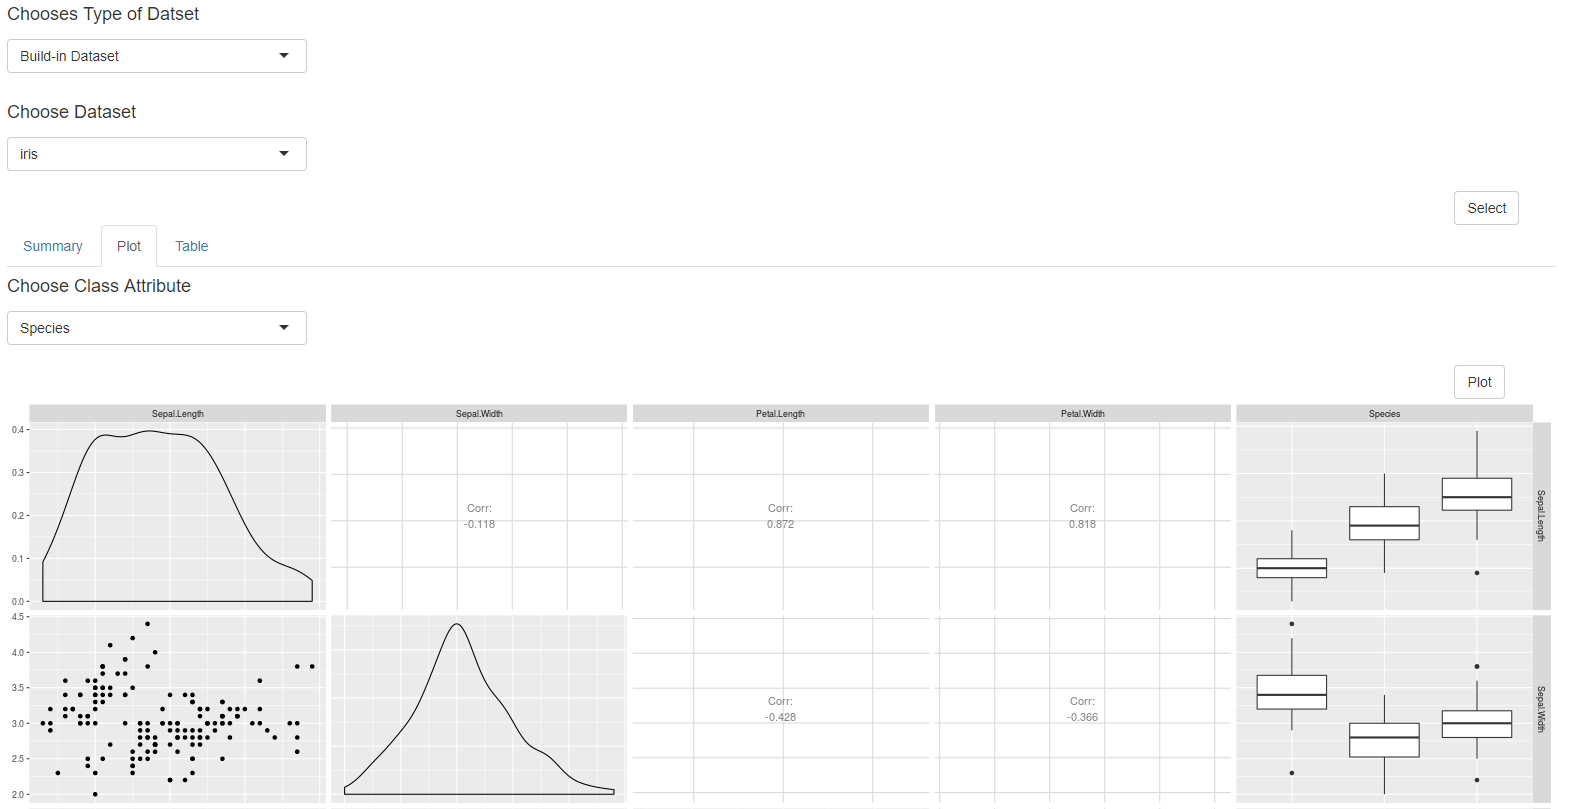
Step 2: Let us visually look at the distribution of each variable within the dataset and visualize the correlation of all variables with one another. It is an important step in data exploration to determine if there is any abnormalities within the data.
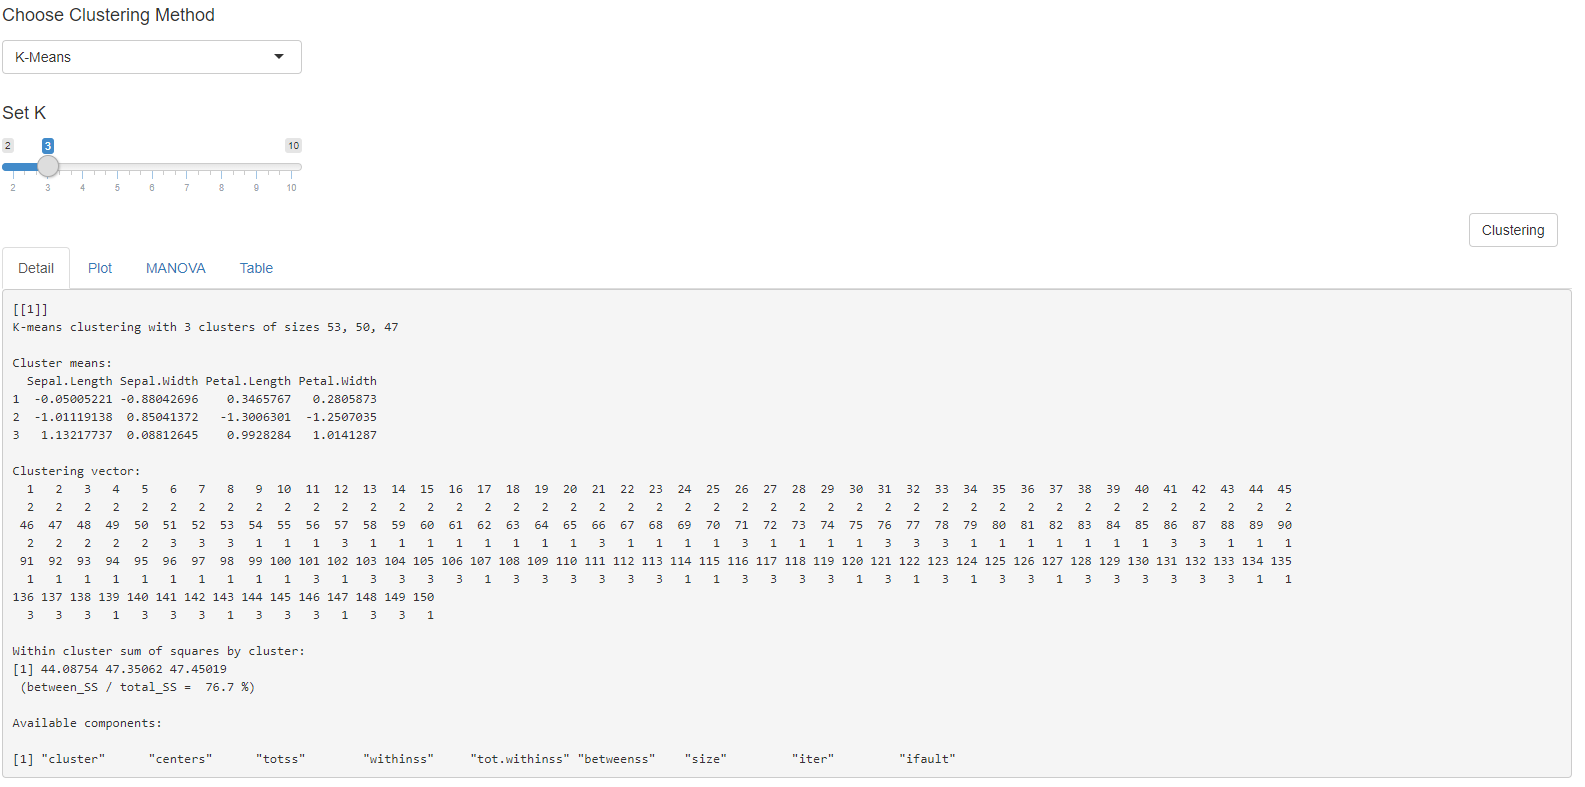
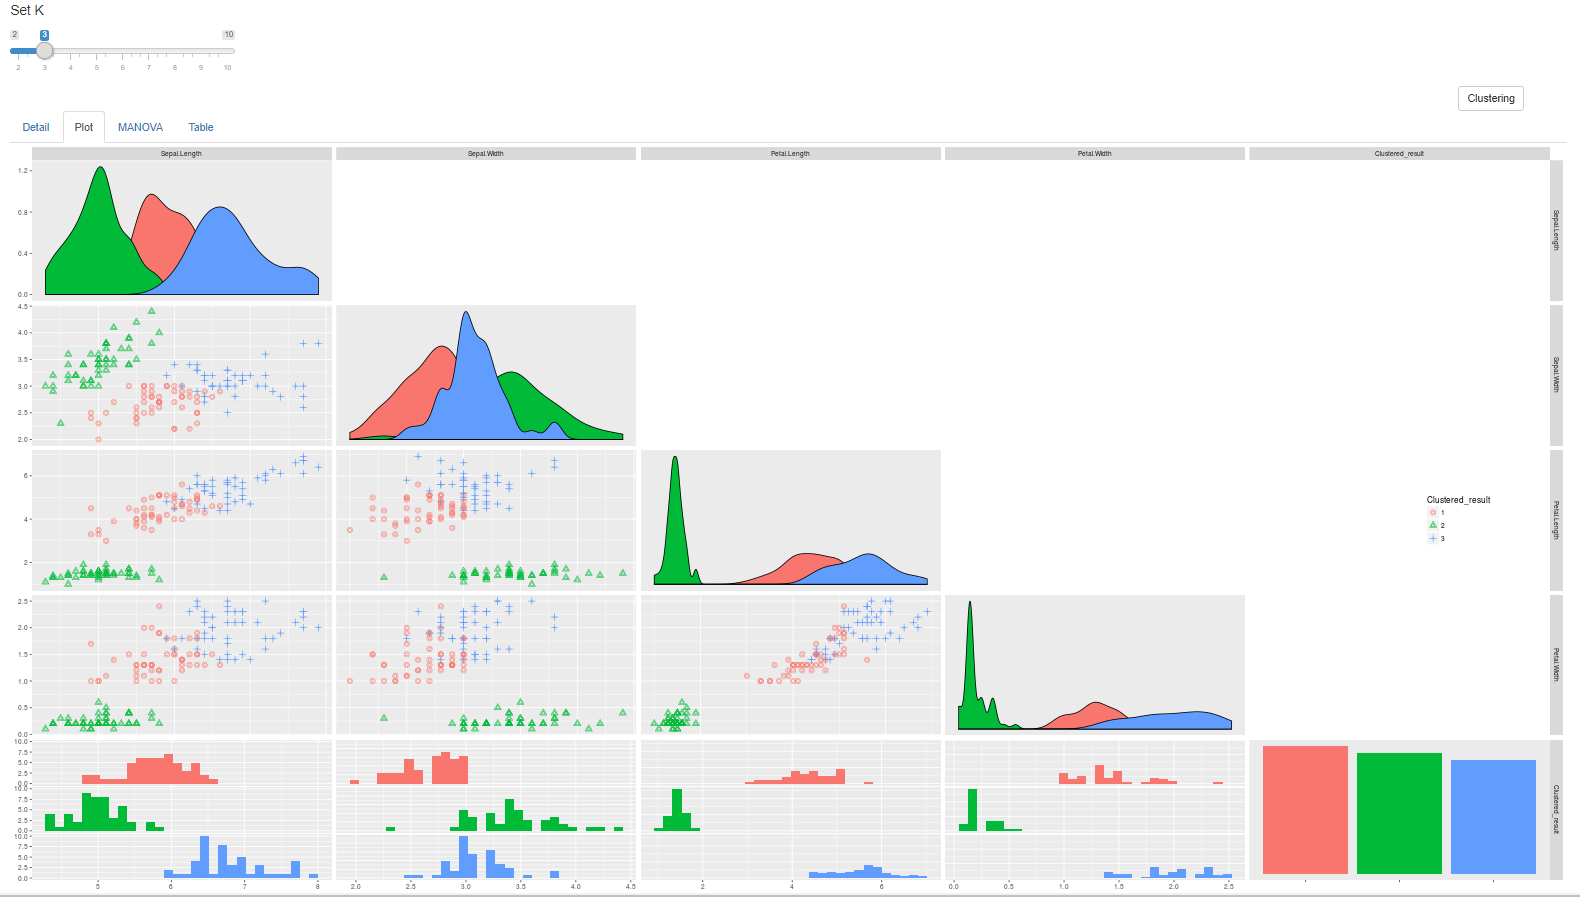
Step 3: Let us experiment first clustering techniques on the given dataset. We have four option: K-means, Expectation Maximization (EM) Clustering, Spectral & DBSCAN Clustering. I have selected K-means for experiment purpose and below are the results of the algorithm. The results are also plotted to help the users understand the internal flow of the algorithm and to identify the importance of each variable in the analysis
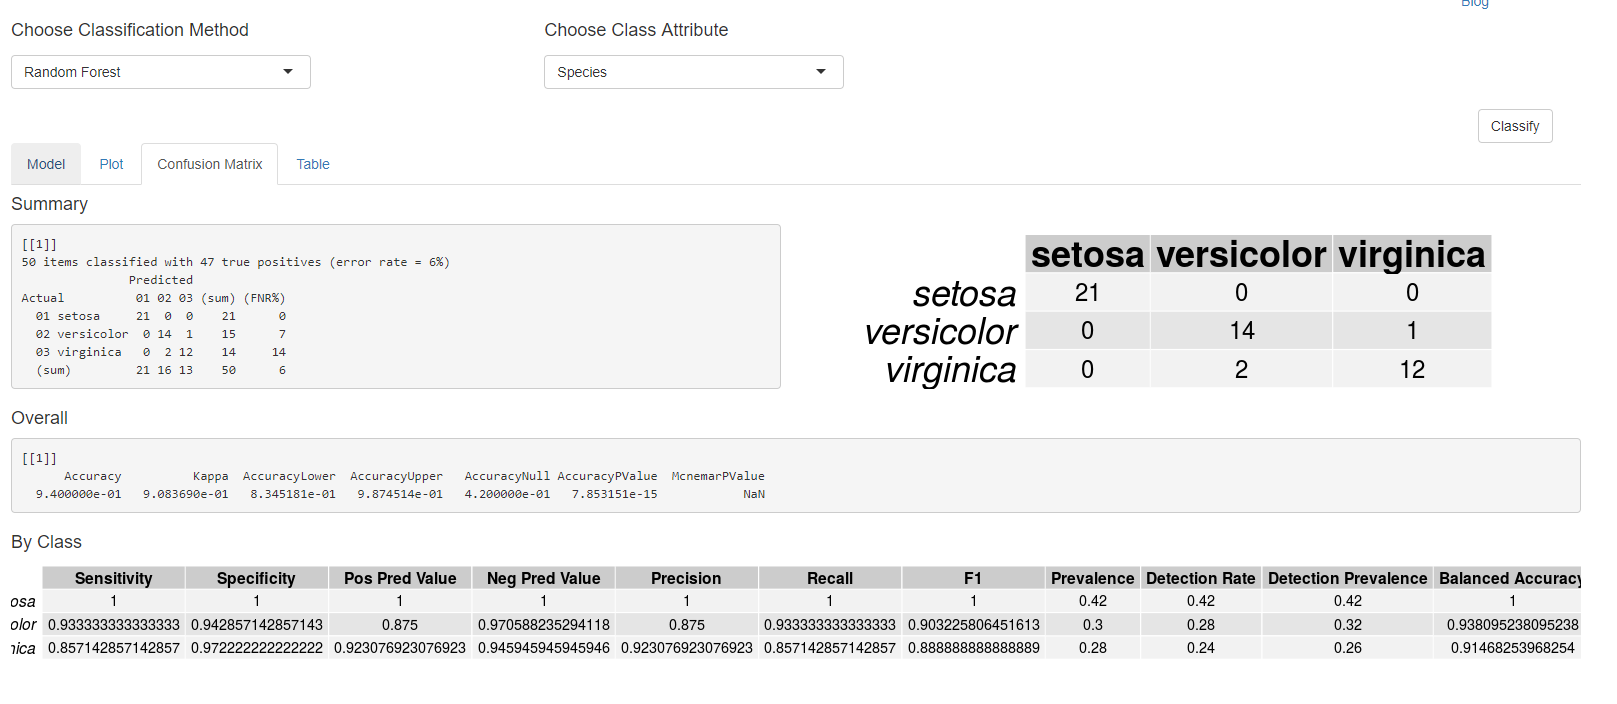
Step 4: Finally, we also wish to predict the class of each flower. We have six classification algorithm choice to determine the best one. Each algorithm can be compared against the other for various performace metrics ranging from accuracy, sensitivity, specificity, Precision, Recall, F1 Score. The results can also be viewed visually for better understanding of the performence of each algorithm on the dataset.
Future implementation :
Adding support for regression problems. Implementing & supporting PCA, MCA, CA, BADA, MFA, STATIS techniques.
Tool Suggestions:
If you have any suggestions or advices for the tool, please contact me
